
A global compilation of dissolved iron measurements: focus on distributions and processes in the Southern Ocean
A data synthesis effort recently compiled over 13,000 observations of dissolved iron concentrations that more than doubled the previous data compilation. A systematic analysis of the distribution of data in the Southern Ocean was performed using four regions, six basins and five depth intervals as a framework. Substantial variability in the depth dependent trends were found between different basins and regions, which were indicative of the possible underlying influence of ocean physics, chemistry and biology. Alessandro Tagliabue’s and co-authors (Tagliabue, et al. 2012) analysis was able to highlight where observations are lacking in a particular region or time of year, which they hope will assist future sampling efforts. Overall, more observations have been collected in the past 5 years under the auspices of the International Polar Year and GEOTRACES efforts than were collected in the prior ~15 years. Nevertheless, despite this progress the seasonal cycle of iron that can be extracted from the well-sampled region south of Tasmania remains enigmatic. From over 160 observations, they find little evidence of ‘winter recharge’ in iron concentrations and instead find the highest iron concentrations to be coincident with the highest phytoplankton biomass levels. This might reflect gaps in seasonal sampling between July and November or the influence of the so-called ‘ferrous wheel’ in driving the recycling of iron. This clearly highlights the need for more measurements of iron at ‘seasonal transitions’, even in well-sampled areas.
This dataset will prove useful for other regional synthesis studies or the evaluation of ocean biogeochemical models. It continues to be maintained by A. Tagliabue and is available from GEOTRACES Data Assembly Center web site or http://pcwww.liv.ac.uk/~atagliab.
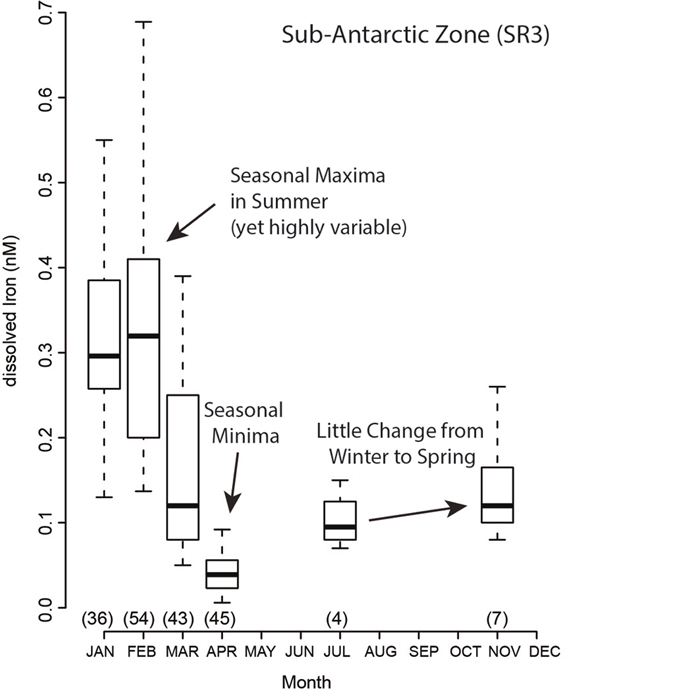
Figure: Box and whisker plot of the seasonal cycle of dFe in the upper 100m for the Subantarctic SR3 (164 total observations from 1995–2008). The SR3 region is defined as that south of 45° S and encompassing 135° E to 155° E, with the Subantarctic and zone isolated using the mean local position of the Polar Front. The size of the box represents the 1st to 3rd quartiles, with the vertical bar corresponding to the median and the whiskers representing 1.5 times the inter-quartile range.
Reference:
Tagliabue, A., et al. (2012) A global compilation of dissolved iron measurements: focus on distributions and processes in the Southern Ocean, Biogeosciences, 9, 2333-2349, doi:10.5194/bg-9-2333-2012. Click here to access the paper.