Methods to measure major particle composition – Posts from former Forum (2011-2012)

On the table below you can read the posts of the forum on “Methods to measure major particle composition” which was maintained by Phoebe Lam in 2011-2012. This forum is not any more available.

Welcome–1st posting was created by Phoebe Lam, 08 Dec 2011 23:20 

Welcome to all who are interested in measuring major particle composition (POC, CaCO3, opal, lithogenics).

What: The purpose of this forum is to provide an interactive space to discuss people’s experience with various methods, and to provide a resource for those who haven’t made these measurements before. I have started the forum with a summary of the motivations for starting this forum, and then a summary of the methods for measuring major particle composition that I am aware of based on my experience, some literature review, and conversions with Jim Bishop, Mark Brzezinski, Rob Sherrell, and Steve Manganini. Note that this is not a formal or comprehensive review, but simply a starting point for discussion. Please read through the post, and add your comments about your experiences with these methods, or comments describing alternative methods together with their merits and liabilities.

How: Reply to the post by clicking “Quick Reply” for a text-only reply, or “Reply” for more formatting functionality. Click on “Subscribe” if you wish to have yourself notified about replies to this topic. If you wish to start a new topic discussion, please click on “New Topic”.

Why: One of the recommendations to emerge from the 3rd GEOTRACES Data-Model Synergy Workshop held 14-17 November 2011 in Barcelona, Spain, was the importance of measuring total suspended particulate mass (SPM) and major particle composition (particulate organic matter (POM), CaCO3, biogenic silica, and maybe oxyhydroxides) for GEOTRACES.

Since major particulate phases are not always routinely measured by the GEOTRACES community, and since they were not part of the official GEOTRACES intercalibration activities, this forum is meant to be a resource to those new to these measurements, as well as provide a forum for discussing the advantages and disadvantages of methods currently in use.

An email from Francois Lacan summarized it nicely: “In my opinion the Barcelona Geotraces data/model synergy workshop confirmed the high importance of measuring particle dry weights – or better, particulate TEI carrying phase concentrations- on GEOTRACES cruises. It seems to me that the modellers need that information (as they work with particle concentration fields), but that the experimentalists often don’t measure it (often experimentalists report their data as mass of TE per mass of water, because they don’t know the mass of particles per mass of water). I believe that this situation is an obstacle for data/model synergies.”

There was general (but not unanimous) consensus that obtaining suspended particulate mass by the method of adding up the major chemical phases of particles (“chemical dry weight”) was more efficient than direct measurements of dry weight (“gravimetric”), as it circumvents the difficulties associated with adequately correcting for the mass of residual salt for gravimetric dry weights (eg. Lam and Bishop, 2007, Deep-Sea Research II, 54: 601-638 ), and at the same time provides major particle composition information. Jim Bishop showed that when done carefully, chemical and gravimetric dry weight had good agreement for open ocean size-fractionated particles (eg. Bishop et al. 1977 Deep-Sea Research, 24: 511-548 ).

Summary of methods:
For the US GEOTRACES North Atlantic Zonal Transect (US NAGZT), we are still testing various methods and have not yet settled on the final protocols, so comments are very welcome. The methods described below assume the filter types we used on US NAGZT–a 51um polyester prefilter (Sefar PeCap) followed by a pre-combusted quartz fiber filter (Whatman QMA) for POC, or an acid-leached polyethersulfone filter (Pall Supor) for trace metals and opal. Note that we were not able to find a single filter type that would be suitable for measurements of all major particulate phases (for more information, please see chapter 10: In-situ Pumping Sampling Protocols For Particulate Trace Metals of the Sampling and Sample-handling Protocols for GEOTRACES Cruises “cookbook” ).

Particulate organic matter (POM):
• Sample handling:
o >51um size fraction: particles on the >51um polyester prefilter cannot be analyzed directly by combustion for POC or POM. Particles are rinsed at sea using filtered seawater onto a 1um silver or pre-combusted QMA filter and then dried at 60°C. The silver filter is used when the sample will also be counted for 234Th.
o <51um size fraction: For the <51um size fraction, the QMA filters are dried at sea at 60°C overnight, and then stored dried until analysis. A subsample punch is taken for analysis by direct combustion.
• Sample analysis:
o Samples are pelletized and analyzed by direct combustion using a CHN elemental analyzer. Samples analyzed directly will result in total Particulate Carbon (PC), which is a sum of particulate organic carbon (POC) and particulate inorganic carbon (PIC). For POC, one has to either fume the samples with acid (eg. open container of concentrated HCl in a dessicator) prior to analysis to liberate the PIC, or subtract PIC determined independently from the total PC (see Ch. 15 of JGOFS protocols ).
o Analysis of particulate phosphorus (POP) by ICP-MS and conversion to POC using a Redfield C:P ratio is problematic below the euphotic zone because POP is more labile than POC, and C:P of particles increases significantly with depth.
• Conversion of POC to POM:
o Elemental analyzers will provide a concentration of carbon, which must be converted to particulate organic matter (POM) for dry weight. The simplest conversion is to assume that POM has the simplified formula of CH2O, and that 1g POC is equivalent 2.5g of POM. However, analyses of plankton by NMR ( Hedges et al. 2002 ) and inverse methods ( Anderson and Sarmiento, 1994 ) have shown that a lower ratio is more appropriate (eg. POM:POC=1.88 g/g Lam and Bishop, 2007 ).

CaCO3 / Particulate Inorganic Carbon (PIC):
• Particulate inorganic carbon (PIC) is primarily CaCO3. The two main methods for determining PIC are by measuring Ca or by measuring carbon associated with carbonate.
o From Ca: assume that particulate Ca derives from salt, intracellular Ca, and CaCO3. Requires simultaneous measurement of another salt-dominated cation (eg. Na) to correct for salt-Ca, and another biogenic element (eg. P) to correct for intracellular Ca (eg. Lam and Bishop 2007 ). This can easily be done on an ICP-MS following a weak leach (eg. 0.6N HCl) of samples.
• Caveats: because the concentrations of Ca and Na are many orders of magnitude higher compared to many trace elements (eg. Na can be 10 orders of magnitude higher than Co), it can be difficult to simultaneously measure all desired elements from a single digest solution. Rob Sherrell uses Rb instead of Na to correct for salt-Ca (pers. comm.) to overcome this problem.
• I have not yet tried this technique after a strong acid digest in a region with high lithogenic contribution, where a correction for lithogenic Ca (eg. using crustal Al:Ca?) would likely be needed.
o From C, directly: this method relies on closed-system conversion of PIC to CO2 upon the addition of acid (eg. 1N phosphoric acid), and the direct measurement of CO2 by coulometry (eg. Honjo et al. 1995, Deep-Sea Research II, 42: 831-870 ).
o From C, indirect (by difference): the difference between TC without and with fuming gives the PIC.
• Caveat: This method may not be accurate in the upper 1000m, where POM dominates and PIC makes up a small percentage (<10%) of particles. In deep sediment trap samples, the coulometric and by-difference methods had good agreement ( Honjo et al. 1995 ).
o We are testing the indirect vs. direct methods for a subset of GEOTRACES samples
• The contribution of PIC to chemical dry weight is simply as stoichiometric CaCO3.

Biogenic silica/opal:
• The measurement of biogenic silica usually involves dissolution in a weak base and analysis of Si by spectrophotometry or by ICP-OES. The most common weak bases used are Na2CO3 (0.9-2M range) or NaOH (0.2-1M range), usually for 1-4 hours at 80-95°C, depending on the protocol. The goal is to achieve complete dissolution of biogenic silica while minimizing dissolution of lithogenic Si. This is an important consideration in regions with high lithogenic Si but low biogenic Si contribution (eg. oligotrophic regions with high dust deposition, such as for the US NAGZT).
• Various methods are used to minimize or correct for the contribution of lithogenic Si:
o On the simplest end, a short leach using Na2CO3, which appears to attack aluminosilicates less than NaOH, is used to minimize lithogenic Si dissolution. The difficulty is to find the optimal leaching time, which may differ in different ecosystems and lithogenic Si loads.
o Other methods use aluminum in the weak base leachate to correct for dissolution of aluminosilicates (eg. Ragueneau et al. 2005 Continental Shelf Research, v. 25: 697-710 ), but variability in dissolution of Al:Si between different regions may make this impractical (Brzezinski, pers. comm.).
o The method that we are testing in my lab is to do time course experiments over 3-4 hours using 0.2M NaOH (eg. DeMaster 1981 GCA, 45: 1715-1732 ) or 0.9M Na2CO3 (Brzezinski, pers. comm.). The principle is that the biogenic silica dissolves quickly (within an hour), and the lithogenic Si dissolves slowly but linearly. The intercept of the Si extracted vs. time plot gives the biogenic silica. We have found very high lithogenic:biogenic Si ratios in some of the NAGZT samples, and this technique seems to work nicely. The downside is that it is very time consuming, so we are searching for ways to increase the efficiency—perhaps not doing it for every sample, and using occasional time courses to determine optimal single-step leaching times.
o An alternative is to do a complete dissolution of all Si including lithogenic Si (using HF), and correct for the lithogenic Si using a lithogenic Si:Al ratio (eg. Honjo et al. 1995 ). Variability in the lithogenic Si:Al ratio will cause errors when lithogenic material is high and biogenic Si is low.
• The contribution of biogenic silica to chemical dry weight often assumes that opal is a hydrated form of silica: SiO2.(0.4H2O) ( Mortlock and Froelich, 1989, Deep Sea Research A, v. 36(9): 1415-1426 ).

Lithogenics:
• Aluminum is the most common element to use as a lithogenic tracer; others include Ti and 232Th. As Rob Sherrell mentions below, not all particulate Al is crustal, but there is more variability in the Ti and 232Th composition than for Al.
• The most straightforward technique is to measure total particulate Al after a strong digest using HF, and scaling up to a mass of lithogenic material using average crustal abundances (eg. 8.0 wt%, Taylor and McLennan 1995, Reviews of Geophysics, 33: 241-265 )

Oxyhydroxides (may be important for hydrothermal vent plumes):
• Oxyhydroxides (Fe and Mn) are not usually a significant contributor to the dry weight of particulate matter in the upper water column, but they may be significant or even dominant in some environments, such as in hydrothermal vent plume particles. Many operationally defined leaches exist, from weak acids to reducing reagents. It could be that in regions in which oxyhydroxides are a significant contributor to total particulate dry weights, that simple corrections of total concentrations of Fe or Mn using Al for lithogenic contributions is sufficient.

***
Some comments from Rob Sherrell via email:
1. Particulate Al is not all crustal – see papers on biogenic particulate Al and on % of Al soluble in weak leaches like 25% acetate. Particulate Ti is more refractory, but much more variable as a crustal normalizer.
2. Opal determination without contamination from ordered silicates is laborious and most difficult when opal/clay ratios are low. I’m not sure how well the uncertainties are being addressed by e.g. Mark Brzezinski and most recently by Phoebe Lam etc.
3. POP may not be in Redfield ratio to POC, yet POC cannot be determined on plastic filters, which are required for the rest of the TE’s. Phoebe is therefore doing parallel filtration on plastic and quartz filters, albeit of different nominal pore size, on the current Atlantic section. PON may be somewhat better and may be possible on plastic filters?
4. Fe oxyhydroxides can be a significant carrier and mass contribution – agreement about leaching methods to isolate them is the subject of 30-50 years of contentious discussion about methodology, starting probably with soil science.
5. CaCO3 should be one of the most straightforward determinations, but seasalt contamination can be a substantial correction, especially for example in Southern Ocean waters with few calcifiers in the particulate matter. Yet some are suspicious of distilled water rinsing of sampled filters. Jim Bishop notes that storage of the filter post-sampling can fractionate major ions and make salt corrections inaccurate.


Replied by Aristomenis P. KARAGEORGIS on topic
 Welcome–1st posting, 23 Dec 2011 20:08
During the Barcelona Geotraces meeting I asked why SPM concentration is not determined routinely by water filtration, and I realized that other colleagues, like Francois Lacan, had similar concerns.
I think the chemical determination of all (?) SPM constituents is too much trouble and involves many, and different types of analytical methods, as described in the literature cited by Phoebe. I don’t believe that all groups who need an SPM concentration have the ability to make all the analyses required.
The major problem seems to be salt, which in the case of pumps cannot be removed. However, I have a relatively simple on-board filtration setup, which can eliminate the salt problem. The idea is to filter e.g. 10 L of seawater using light (e.g. polycarbonate filters; 47mm diameter, 0.4 micrometers pore-size) and be very careful to rinse several times the filter with MilliQ (pH adjusted) to remove sea salts before they crystalize. Essentially that means you have to be in the lab many hours and wait until filtration is about to end, or to decide at which volume you will stop filtration. Sea salts can be easily removed while in solution. We have seen that in scanning electron microscope images, where some filters are completely salt-free, and in others salt cubes are abundant. If someone gets tired and goes to bed, leaving the filter to dry, can explain the latter situation. The rest of the procedure is more or less known. Weighing the filters very carefully prior and after filtration is crucial. The balance room and equipment must be ideal and if possible the personnel performing measurements should be the same person.
An estimate of particulate matter concentration can be also correlated against transmissometer measurements (beam c), and a marked correlation can provide much more useful data. Likewise, particulate organic carbon concentration can be correlated against beam c.
I strongly encourage Geotraces colleagues to measure routinely particulate matter concentration because it is a fundamental parameter that can be used in many applications, and modelling in particular.
I will be glad to provide any details regarding the filtration set-up, and some results can be found in Karageorgis et al., 2008. Deep-Sea Res. I, 55: 177-202 .
Aris Karageorgis
 

Replied by Phoebe Lam on topic Welcome–1st posting,  24 Jan 2012 20:07
 
Dear Aris,
Thanks for your posting and to the reference you provided. Your suggestion may be useful for some colleagues as an alternative to measuring SPM directly if chemical determination of major SPM constituents is impossible.
One of the problems with weighing filters as you suggest is that particle collection, at least on the US GEOTRACES cruises, has moved to the use of depth filters such as quartz fiber filters (QMA) and polyethersulfone (Supor) filters. This is because these depth filters have far superior flow characteristics than polycarbonate filters, allowing in-situ pump filtration of the much larger volumes that are necessary for measurement of some radionuclides (through QMA and Supor) and also faster filtration times from in-line filtration from GO-Flo bottles (through Supor). The trade-off for better flow characteristics is more seawater retention by these filters, and thus more salt, making weighing impractical on the particle samples that are already being collected for TEI measurements. Measuring SPM as you suggest would require a dedicated person at sea as well as a dedicated bottle for this single measurement, which may be difficult with the limited berths and water budgets that have characterized the US GEOTRACES cruises, but may be possible for other cruises.
Cheers,
Phoebe
 

Replied by Phoebe Lam on topic Welcome–1st posting, 11 Feb 2012 03:16

I received an email regarding biogenic Si analysis from Sven Kretschmer of AWI on February 1, 2012. I’ve copied his email as well as my response.


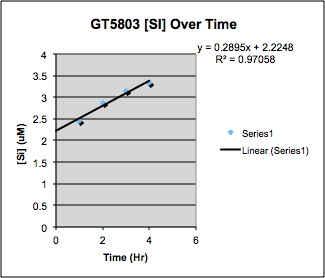
I will partly adopt your time series protocol and now that I will start my first test soon, I would like to kindly ask you some more questions regarding this protocol:Is the 0.2molar NaOH not too strong? I am afraid that the reaction goes to fast.
On what it depends if you take the subsamples every hour or every half hour?
I still don´t understand quite well how to calculate the bSi from 4 timepoints. Aren´t these too few points to make an extrapolation?
Are you able to calculate the lithogenic Si from these 4 timepoints, or is there a need to make a final leach with weak HF in order to know the total Si? Is it of interest at all to know the lSi, because I will anyway determine the lithogenic component by another (multielemental) analysis.
When measuring on the spectrophotometer why is the transmission more accurate than the absorbance?–
I’ve pasted below what one of our timeseries looked like using 0.2M NaOH. We took samples at 1, 2, 3,4 hrs, then fit a line. The interpretation is that biogenic silica comes off quickly (before the first time point), but lithogenic silica dissolves slowly and linearly with time (see Demaster 1981). The intercept (in this case 2.2uM) was taken to be the biogenic silica.

[We are] going to do some tests to compare the slopes using 0.2M NaOH and 1M Na2CO3, and see whether we can get away with doing fewer time points.You cannot get lithogenic Si from these timepoints only; you would have to do a final leach with HF to get that. I skip that part, and calculate lithogenic material using Al in my ICP-MS runs of a HF-HCl-HNO3 digest.Re transmission vs absorbance: I think the idea is that the instrument measures transmission, whereas absorbance is calculated using measured transmission in a reference, your sample, and in the dark. If tehre is drift in the reference or dark, then the calculated absorbance will be off. We measure the reference and dark regularly to monitor for drift and calculate absorbance.


bSi_series.jpg
Replied by Sven Kretschmer on topic Welcome–1st posting, 16 May 2012 10:27


Hi Phoebe,
I have another question regarding the time course method for biogenic Silica:
During the leaching with NaOH you take a subsample of 4 mL at each time point. This sampling changes the volume of the leaching solution. How do you consider this change in volume for the subsequent time point?
1) do you compensate for the sampling by adding 4mL new NaOH?
2) do you reflect this change in volume by calculating the dilution factor?
cheers.
sven

Replied by Phoebe Lam on topic Welcome–1st posting, 16 May 2012 12:27


Hi Sven,
Thanks for your email–this reminds me that I should update my previous posting. The quick answer is that we account for the decrease in volume. But we’ve also made some adjustments to the protocol:
-We still start off with 20mL of 0.2N NaOH, but we now subsample 1.6mL instead of 4mL at each timepoint. This is partly to reduce the dilution effect even though we account for it, and also because we have moved to using a smaller 5cm-pathlength cuvette that doesn’t require as much volume.
-Our test data with 1M Na2CO3 were not as well-behaved as with 0.2N NaOH, so we are proceeding with the 0.2N NaOH.
-We’ve found that the timepoints using 0.2N NaOH are very linear, so we’ve now reduced the number of timepoints to N=3 (1hr, 2hr, 3hr), though I think it is worth doing 4 timepoints to begin with if you are just starting.
-Because of the reduction in volume at each timepoint, we now do our accounting (including linear regression) in the units of mol Si, rather than in concentration units
-It is important to do timecourse of blank tubes and blank filters, as we’ve sometimes found a positive slope on blank filters that we then correct for.
-We have found that the correction from the timecourse tends to be significant for samples deeper than 1000m, but tends to be fairly modest for most samples shallower than 1000m. We may revert to a single timepoint for shallow samples, but continue the timecourse method for the deeper samples.
-Finally, Jim Bishop has mentioned the possibility of aged opal in deeper samples behaving differently (dissolving more slowly) than fresh opal, thus confounding the interpretation of the slope. Given the high lithogenic load in the North Atlantic, I don’t think this is what is accounting for the slope, but it is always a possibility.

Replied by Sven Kretschmer on topic Welcome–1st posting, 16 May 2012 13:00


Hi Phoebe,
We tested your method with sediment samples, before we will start with my in-situ pump filters.
It worked out well. With 20mL 0.2N NaOH, and 4 time points we got a good linear regression.
We subsampled 2mL, and accounted for the reduction in volume.
Thank you for the further information on your tests and experiences. That helps a lot.
Sven


Rechercher