
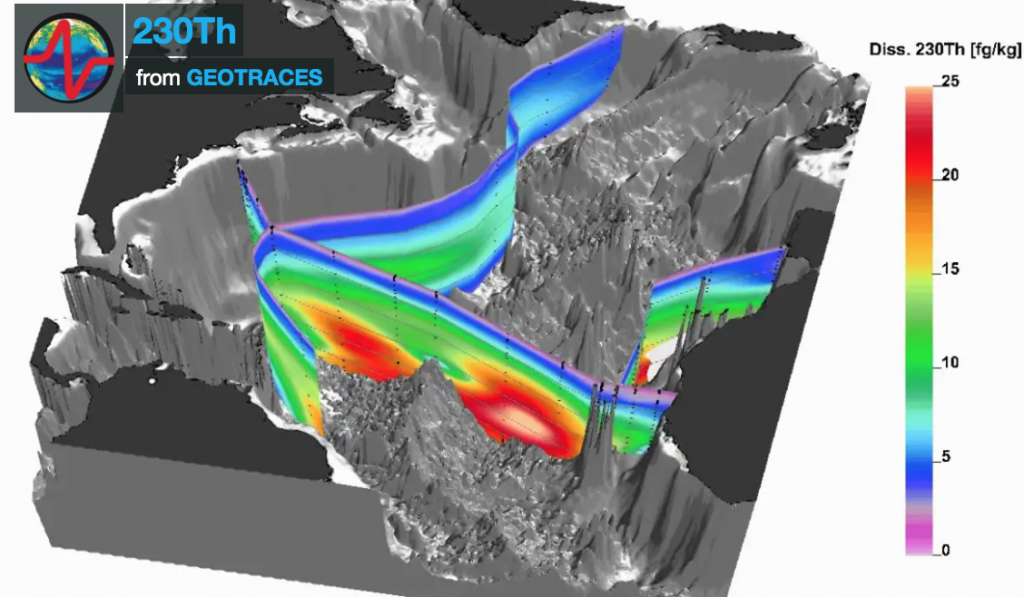
The power of tracers: a 3D animation example of Thorium-230 along GEOTRACES North Atlantic Sections
The central component of GEOTRACES is a series of cruises spanning the global ocean. These cruises collect water and analysis of many trace elements and isotopes. The power of the GEOTRACES field work is demonstrated below by an example of 3D animation resulting from data collected on GEOTRACES North Atlantic cruises:
This animation illustrates the distribution of dissolved Thorium-230 (230Th) in the North Atlantic Ocean along GEOTRACES sections GA02 and GA03 (Click here to access the GEOTRACES Atlantic Ocean section map). Dissolved 230Th is supplied uniformly throughout the ocean by radioactive decay of dissolved uranium. It is removed by adsorption to particles as they sink to the sea floor. Consequently, the distribution of dissolved 230Th informs us about the location and intensity of the processes that remove many trace elements and other insoluble chemicals from the ocean. In addition, the concentration of dissolved 230Th tends to increase with the age of the water, that is, with time since the water mass was last at the ocean surface. This effect is evident here in that dissolved 230Th concentrations tend to increase from the surface to the bottom, from north to south and from west to east, corresponding to increasing water mass age in the North Atlantic Ocean. Departures from this general trend indicate the locations of unusually intense removal by adsorption to particles. Three such examples can be identified: 1) within the plume of hydrothermal particles surrounding the crest of the Mid Atlantic Ridge, 2) near the sea floor where particles resuspended from the bottom enhance the removal process, and 3) approaching the margins of North America and North Africa where the effects of continental erosion and elevated rates of biological productivity cause high particle abundance. Because processes that regulate the removal of 230Th from the ocean also affect other insoluble chemicals, this illustration of the distribution of dissolved 230Th informs us about the fate of many chemicals in the ocean.
You can use the following URL to display this animation on your presentations:
http://vimeo.com/69990808