First direct measurement of actinium (but also radium and thorium) distribution coefficient values in marine sediments
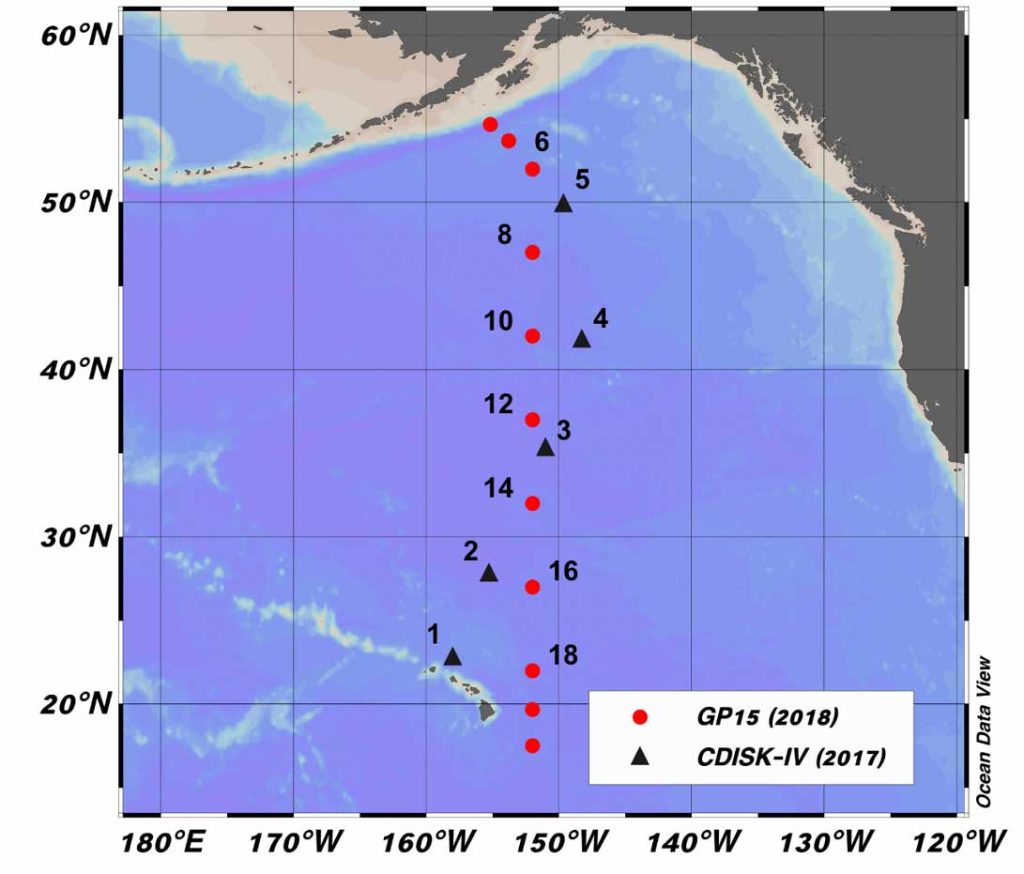
Actinium-227 (227Ac), radium-226 (226Ra) and radium-228 (228Ra) profiles in sediments were measured and modeled at 5 stations in the Northeast Pacific. Data allowed the distribution coefficient (Kd) between the solid and liquid phases for Ac and Ra.
A strong positive correlation is observed between Ra and 227Ac kd values, with 227Ac being almost 6.6 times higher than Ra kd values, and both co-varying with the MnO2 in solid phases.
The source function of 227Ac in the Northeast Pacific was determined by two independent methods: core incubation and reaction transport models. The authors also established the Ra fluxes.
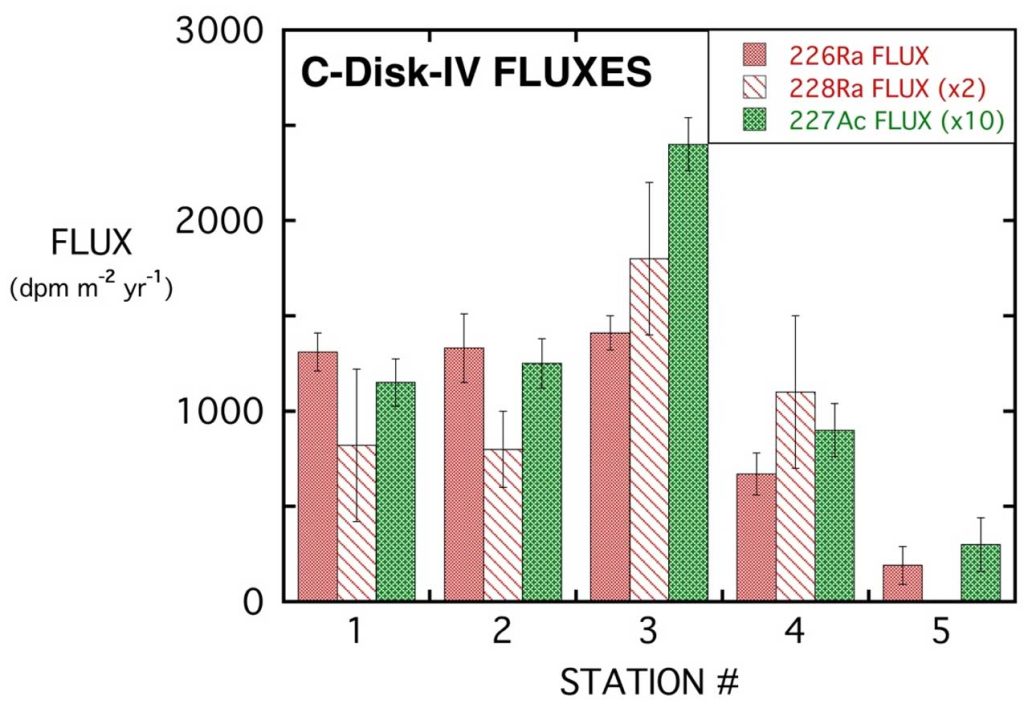
The largest 227Ac and Ra isotope fluxes are near the center of the Northeast Pacific (~37ºN). Smaller 227Ac, 228Ra and 226Ra fluxes occur north of 40ºN, primarily due to dilution of their protactinium and thorium ancestors by higher sediment accumulation rates.
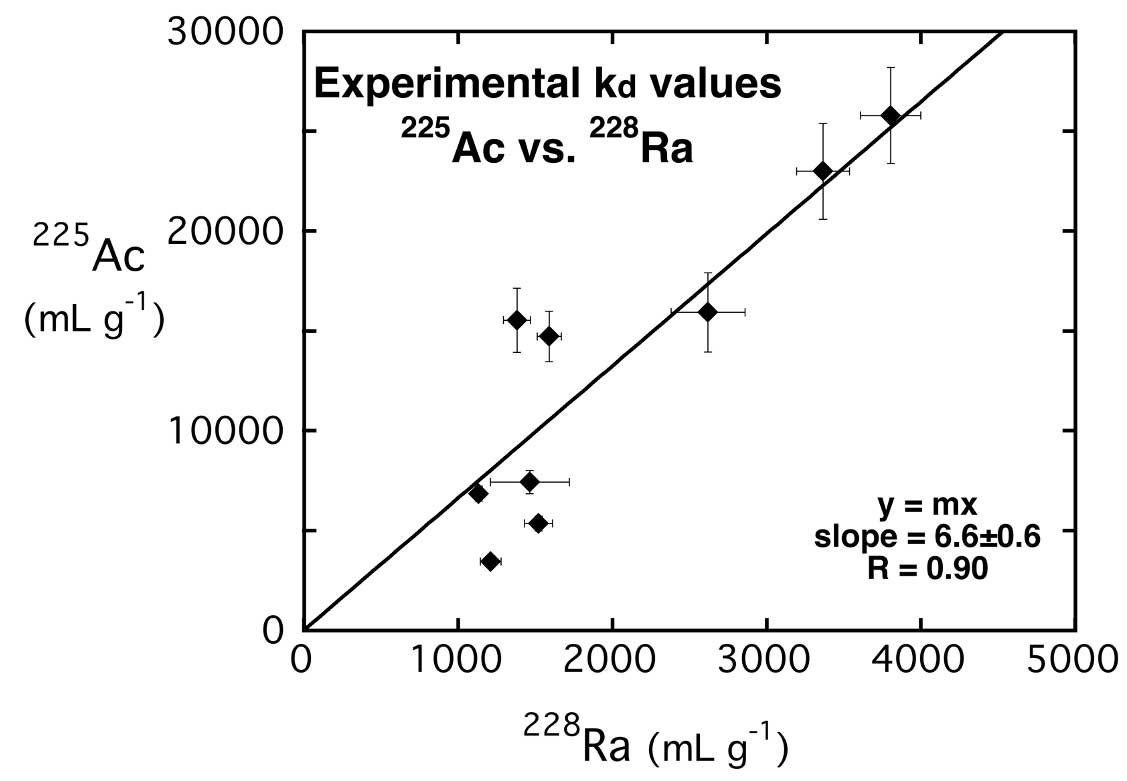
Deep-sea sediments were added to Ra-free seawater and spiked with a known amount of 225Ac and 228Ra. The slurry was then rotated for one-hour, after which sediments and seawater were separated by centrifugation. Sediments and seawater were then measured separately by HPGe (High-Purity Germanium Detector). The regression line on the figure is forced through zero.
Reference:
Kemnitz, N., Hammond, D. E., Henderson, P., Le Roy, E., Charette, M., Moore, W., Anderson, R. F., Fleisher, M. Q., Leal, A., Black, E., Hayes, C. T., Adkins, J., Berelson, W., & Bian, X. (2023). Actinium and radium fluxes from the seabed in the northeast Pacific Basin. Marine Chemistry, 250, 104180. Access the paper: 10.1016/j.marchem.2022.104180