Estimating Atmospheric Trace Element Deposition Over the Global Ocean
Atmospheric input of trace element micronutrients to the oceans is difficult to determine, as even with collection of high-quality aerosol chemical concentrations, such data by themselves cannot yield deposition rates. To transform these concentrations into rates, a method of determining flux by applying an appropriate deposition velocity is required. A recently developed method based on the natural radionuclide beryllium-7 (7Be, T1/2 = 53.3 d) has provided a means to estimate the bulk (wet + dry) deposition velocity (Vb) required for this calculation.
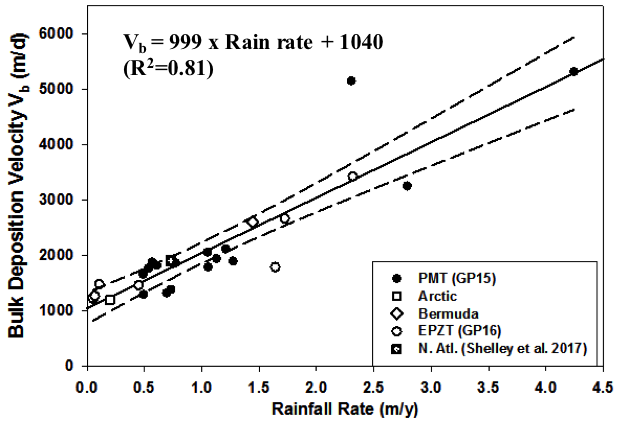
Kadko and co-workers (2020, see reference below) further developed the relationship between the bulk deposition velocities calculated from 7Be data and rainfall rate (Vb = R•S•ρ + Vd ), where Vb should be linearly related to R (Rain rate, m/y), with a slope of S•ρ and an intercept of Vd (dry deposition velocity, m/y). S is the scavenging ratio which is the effectiveness by which aerosols are scavenged by precipitation and ρ is the density conversion. Water column (7Be inventories) and aerosol 7Be concentrations collected during the 2018 US GEOTRACES Pacific Meridional Transect (PMT, GP15, which passed through a substantial gradient in rainfall rate) together with similar data from other ocean basins were used to derive a global relationship between rain rate (m/y) and bulk depositional velocity (m/d), such that Vb = (999 ± 96 x Rainfall rate) + 1040 ±136 (r2=0.81). Thus given a global rain product (Rainfall data were derived from the Global Precipitation Climatology Project (GPCP), a means to estimate deposition velocities based on rainfall is provided (see figure). The intercept of 1040m/d is consistent with the value of Vd commonly assumed in the literature.
References
Kadko, D., W.M. Landing, and R.U. Shelley. (2015). A novel tracer technique to quantify the atmospheric flux of trace elements to remote ocean regions. J. Geophys. Res: Oceans 120, 848-858, DOI: https://doi.org/10.1002/2014JC010314.
Kadko, D., Galfond, B., Landing, W. M., and Shelley, R. U. (2016). Determining the pathways, fate, and flux of atmospherically derived trace elements in the Arctic Ocean/ice system. Mar. Chem., 182, 38-50. DOI: https://dx.doi.org/10.1016/j.marchem.2016.04.006
Kadko D., A. Aguilar-Islas, C. Bolt, C. Buck, Jessica N Fitzsimmons, L.T Jensen, W. M Landing, C. M. Marsay, R. Rember, A.M. Shiller, L. M. Whitmore, R. F. Anderson. (2019). The residence times of trace elements determined in the surface Arctic Ocean during the 2015 US Arctic GEOTRACES expedition. Mar. Chem. 208, 56-69. DOI: https://doi.org/10.1016/j.marchem.2018.10.011
Kadko, D., W.M. Landing and C.S. Buck (2020). Quantifying atmospheric trace element deposition over the ocean on a global scale with satellite rainfall products. GRL. DOI: https://doi.org/10.1029/2019GL086357
Shelley, R. U., Roca-Martí, M., Castrillejo, M., Masqué, P., Landing, W. M., Planquette, H., & Sarthou, G. (2017). Quantification of trace element atmospheric deposition fluxes to the Atlantic Ocean (> 40° N; GEOVIDE, GEOTRACES GA01) during spring 2014. Deep Sea Research Part I: Oceanographic Research Papers, 119, 34-49. DOI: https://dx.doi.org/10.1016/j.dsr.2016.11.010