Surprising cadmium isotope results north of the Subantarctic Front in the South West Atlantic Ocean
Xie and co-workers (2017, see reference below) report cadmium (Cd) isotopic compositions from five stations and 15 tow-Fish surface waters from 50ºS to the equator along GEOTRACES GA02 Leg 3. Along this transect, the coupled Cd concentrations and Cd isotopes reflect classical behaviour dominated by preferential uptake of light Cd by the biological species at the surface, release in the twilight zone and water mass mixing deeper. Surprisingly, ε112/110Cd displays a “flattening off” pattern in the surface and subsurface waters of stations north of the Subantarctic Front, while Cd concentrations decrease to low levels; this observation can be extended to the global Cd isotope dataset at hand for Cd concentrations below a nominal value of 0.1 nmol kg-1. Two explanations are proposed for this behaviour: 1) either Cd is bound by organic detritus, colloids or ligands and passes the 0.2μm filtration of the samples, products which could dominate ε112/110Cd over that of the dissolved pool; or 2) the ε112/110Cd values result from a simple open system, steady-state model for the (sub)surface layer, fed with an in-flux of Cd from deeper waters.
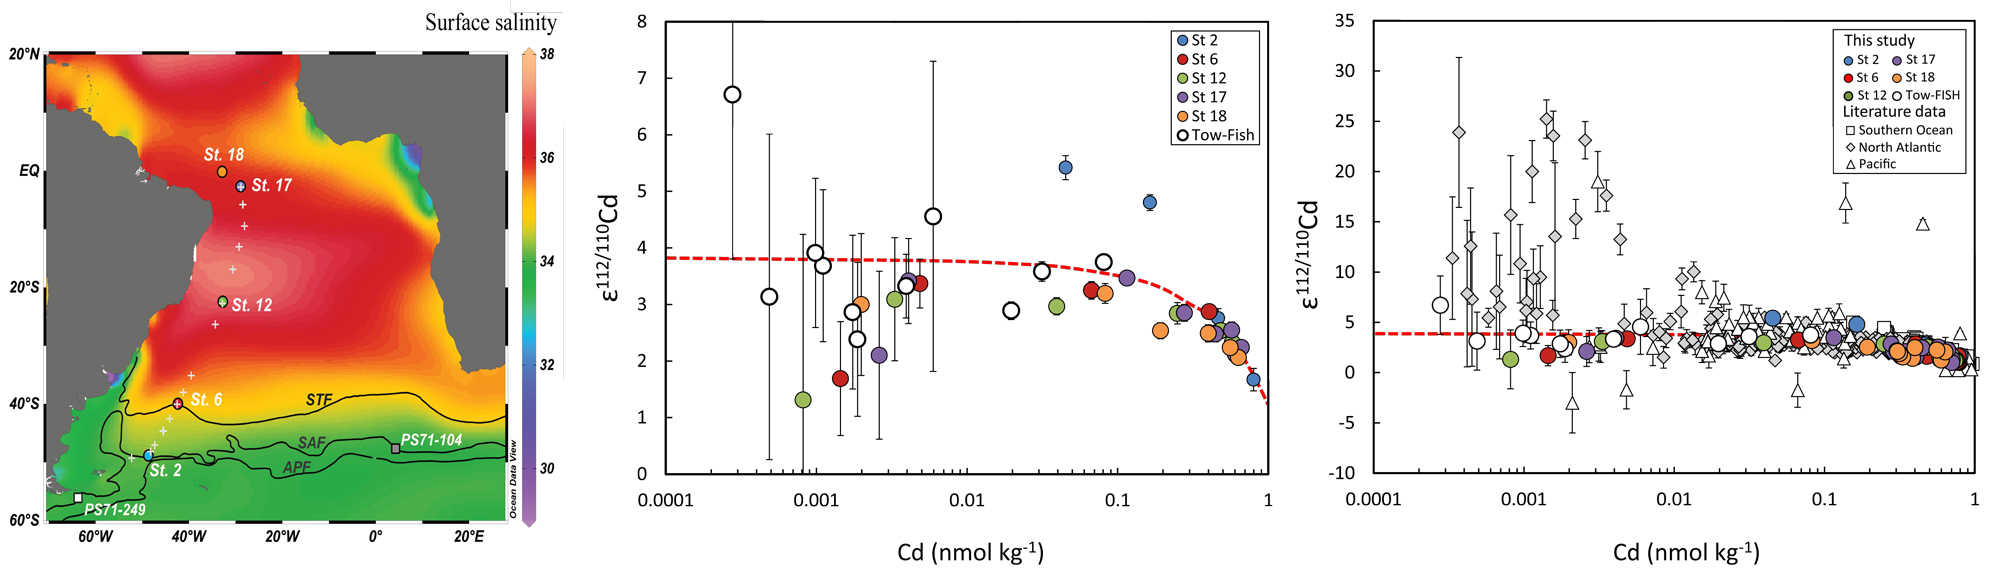
Figure: Map of the five super stations (color circles) and tow-Fish surface sites (crosses) for Cd isotopes along GA02 Leg 3 (Left), and Cd isotope systematics in the western South Atlantic (Middle) and the global ocean (right). Color circles for profile samples, and open circles for tow-Fish seawater samples (this study). In the right-hand panel: grey diamonds – North Atlantic (Boyle et al., 2012; Conway and John 2015a; John and Conway, 2014); open triangles – North (Conway and John, 2015b; Ripperger et al., 2007) and South Pacific (New Zealand (Gault-Ringold et al., 2012), South China Sea and Philippine Sea (Yang et al., 2012, 2014)); open squares – Southern Ocean (Abouchami et al., 2011, 2014; Xue et al., 2013). Red dashed lines in the middle and right-hand panels schematically highlight the evolution of seawater e112/110Cd toward low Cd concentrations. Error bars (2s) are shown. Click here to view the figure larger.
Reference:
Xie, R. C., Galer, S. J. G., Abouchami, W., Rijkenberg, M. J. A., de Baar, H. J. W., De Jong, J., & Andreae, M. O. (2017). Non-Rayleigh control of upper-ocean Cd isotope fractionation in the western South Atlantic. Earth and Planetary Science Letters (Vol. 471). DOI: 10.1016/j.epsl.2017.04.024