A new brick to the zinc-silicate-phosphate oceanic story
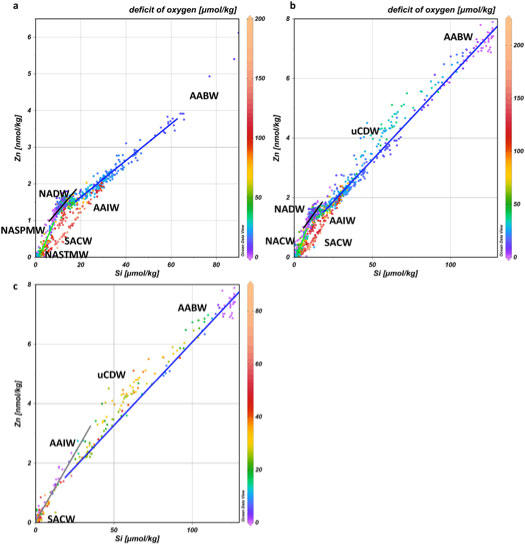
Middag and co-workers (2019, see reference below) established the distributions of dissolved zinc (Zn), silicate (Si) and phosphate (PO4) at high resolution along the GEOTRACES transect GA02, in other words, covering the North and South Atlantic Ocean from Greenland to the tip of South America. This section track allowed them to unravel the influence of various water masses and local biogeochemical processes on these 3 tracers in the Atlantic Ocean. Although they confirm that the Southern Ocean water masses play a driving role in the distributions of these elements, the authors also show that subsurface water masses from northern origin are depleted in Zn, implying that the depletion of Zn occurs not only in the source region of Subantarctic Mode Waters as previously suggested. They also demonstrate that Atlantic remineralization has a profound influence on the PO4 distribution, but not on the distribution of Zn and Si. These 2 elements have a more limited supply to the surface ocean from underlying water masses and their fates are mostly governed by mixing of the various water masses along this transect. Both northern and southern high-latitude waters display a relatively high Zn:PO4 uptake and remineralization ratio, implying it is Zn availability and not only Fe limitation that leads to increased Zn uptake in the high-latitude regions. A close look at the Zn-Si relationships, allowed by the high resolution of the data, also show that it varies between the different water masses (see figure below)…the variations are also discussed in this paper!

Figure: The Zn versus Si distribution. (a) The distribution along the transect in the North Atlantic only (north of the equator). (b) The distribution along the entire transect. (c) The distribution in the South Atlantic only (south of 20°S). This figure shows the varying relationships in different water masses with the color scale indicating the deficit of oxygen to represent remineralisation that occurred in the study region. From this figure it is clear there is no universal Zn-Si relationship, but rather that it is the mixing of various water masses that results in an array of mixing lines. Remineralisation along the section is most profound around the equator due to regional upwelling processes that stimulate productivity. Such remineralisation has an apparent effect, as the samples with most remineralisation (warm colors) plot below the majority of the observations. However, this remineralisation effect is very modest and most variation can be explained by the mixing of water masses with radically different concentrations.
Green line: NASPMW mixing with NADW; Black line: mixing of various components of NADW; Blue line: AABW mixing with overlying water masses; Gray line: SACW mixing with AAIW. AABW = Antarctic Bottom Water; NADW = North Atlantic Deep Water; uCDW = upper circumpolar deep water; AAIW = Antarctic Intermediate Water; SACW = South Atlantic Central Water; NASPMW = North Atlantic Sub-Polar Mode Water; NASTMW = North Atlantic Sub-Tropical Mode Water. Reprinted from Middag, et al., 2019. Please click here to view the image larger.
Reference:
Middag, R., de Baar, H. J. W., & Bruland, K. W. (2019). The Relationships Between Dissolved Zinc and Major Nutrients Phosphate and Silicate Along the GEOTRACES GA02 Transect in the West Atlantic Ocean. Global Biogeochemical Cycles, 33(1), 63–84. DOI: GEOTRACES transect GA02
