Disentangling what controls the cadmium distribution in the Pacific Ocean
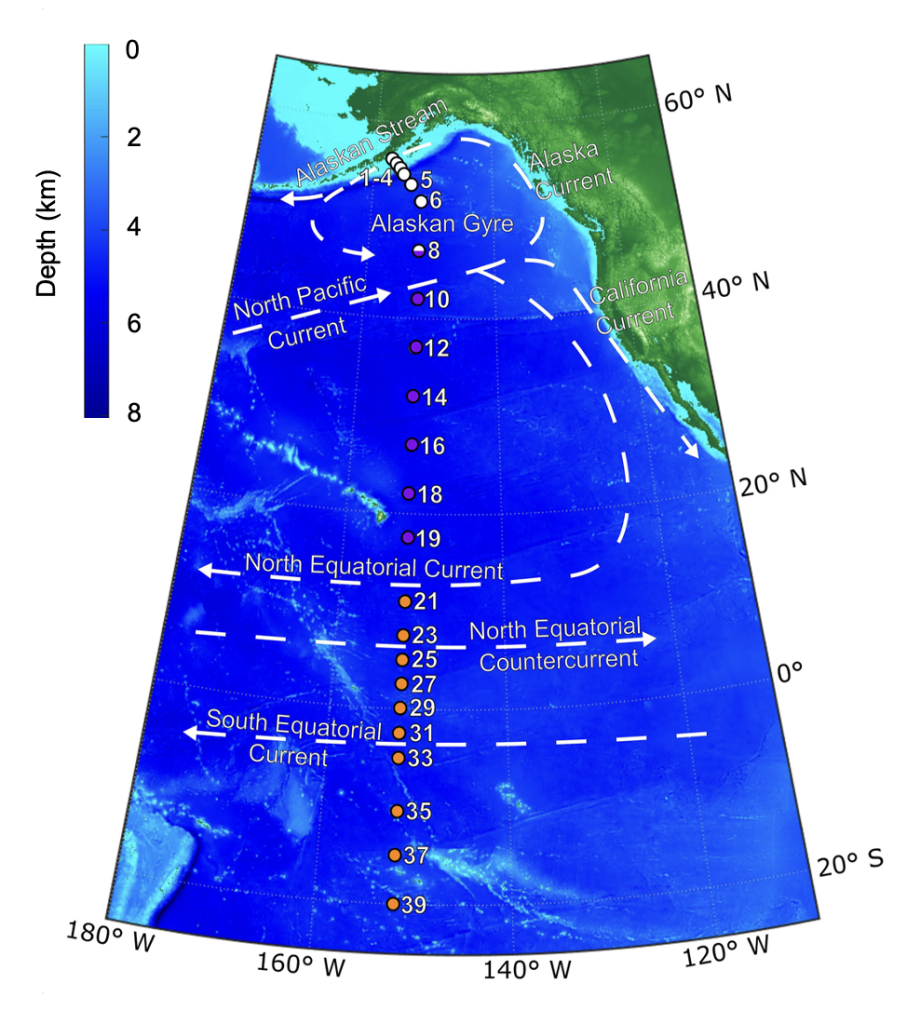
Sieber and his colleagues (2023, see reference below) established the distribution of dissolved cadmium (Cd) concentrations and isotopes at 23 stations (represented as δ114Cd) along the GEOTRACES GP15 section, a meridional transect along 152°W from Alaska to Tahiti.
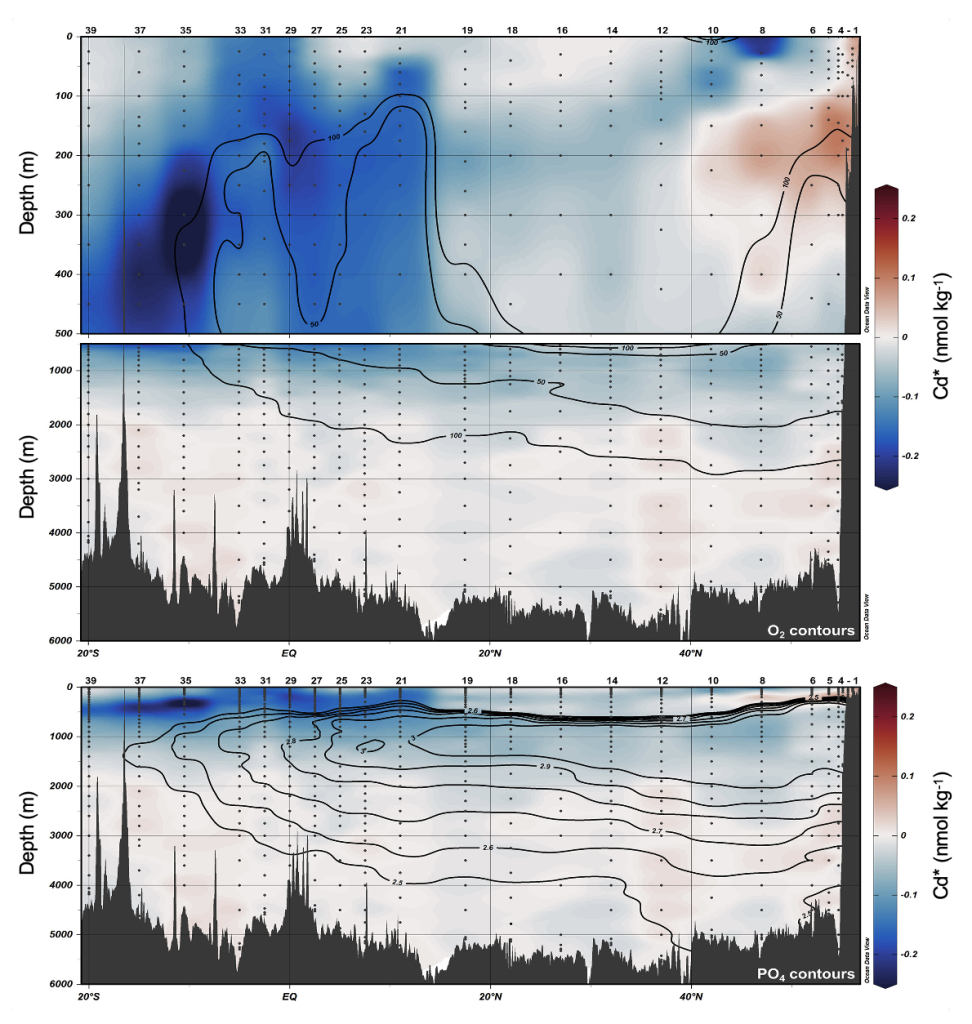
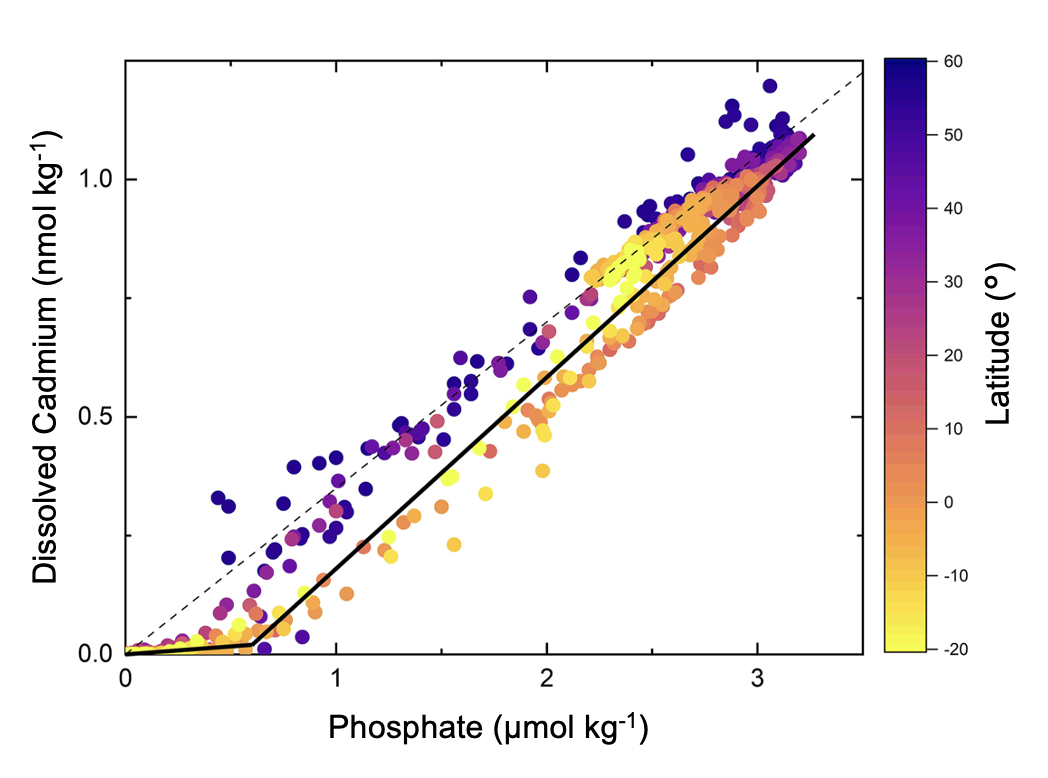
Their data reveal an important disparity between northern Cd-rich high-nutrient low-chlorophyll waters and Cd-depleted waters of the subtropical and equatorial Pacific. In the open ocean, a biogeochemical model simulates the data in Cd-depleted surface waters, with the lowest Cd concentrations influenced by atmospheric inputs of isotopically light Cd. Below the surface (and surprisingly even in the North Pacific Ocean), Cd parameter distributions are essentially controlled by Southern Ocean processes, water mass mixing and regeneration. Indeed, Cd-depleted Antarctic Intermediate Water has a far-reaching effect on North Pacific intermediate waters as far as 47°N, contrasting with northern-sourced Cd signatures in North Pacific Intermediate Water. Last but not least, this study reveals that a correlation between the North Pacific phosphate maximum and a negative Cd* signal at depth in the North Pacific Ocean reflects a regeneration signal of Cd and PO4 at a slightly lower Cd:P ratio than the deep ocean ratio (0.35 mmol mol−1). This finding contradicts the hypothesis that this negative Cd* signal is due to in situ removal processes in low-oxygen waters.
Reference:
Sieber, M., Lanning, N. T., Bunnell, Z. B., Bian, X., Yang, S., Marsay, C. M., Landing, W. M., Buck, C. S., Fitzsimmons, J. N., John, S. G., & Conway, T. M. (2023). Biological, Physical, and Atmospheric Controls on the Distribution of Cadmium and Its Isotopes in the Pacific Ocean. Global Biogeochemical Cycles, 37(2). Access the paper:10.1029/2022gb007441