GEOTRACES Intermediate Data Product 2014
Click here to download this page as pdf file.
Click here to access the IDP2014 Press Review.
This is an old version of the GEOTRACES Intermediate Data Product.
In August 2017, GEOTRACES released a new version of its Intermediate Data Product (IDP2017).
PLEASE click here to access the most recent version of the data product.
NEW! GEOTRACES Intermediate Data Product digital data selection and subsetting service available! Explore it at: https://webodv.awi.de/geotraces |
| Please help us to improve the Intermediate Data Product including the data selection service by sending us your feedback!
|
Main motivation
GEOTRACES is releasing and sharing hydrographic and marine geochemical data acquired during the first 3 years of the programme to strengthen and intensify the collaboration within the broader ocean research community. At the same time, we seek feedback from the community to help us improve future data products.
The Product
The Intermediate Data Product, IDP2014, consists of two parts:
(1) the digital data (Digital data selection and subsetting service available at: https://webodv.awi.de/geotraces) and
(2) the eGEOTRACES Electronic Atlas
The digital data (available at www.bodc.ac.uk/geotraces/data/idp2014/ AND digital data selection and subsetting service available at: https://webodv.awi.de/geotraces) contains data for more than 1000 stations from 15 cruises. More than 70 hydrographic and geochemical parameters are included, and scientists from 10 countries have contributed. The data product covers the Arctic, Atlantic and Indian Oceans, data density being the highest in the Atlantic.
|
Data Access: Users are required to register and agree to usage rules asking for proper citations of the product itself and of the relevant original papers associated with the particular data used. The data are available in 4 formats: ASCII, Microsoft Excel, NetCDF and as ODV collections for use with the popular Ocean Data View software (odv.awi.de). A special effort has been made to link information about data originator, original publications and analytical methods with every data value. Proper linkage to and prominent display of originator information is used throughout the IDP2014 and considered important to provide credit to data producers. |
The eGEOTRACES Electronic Atlas (available at www.egeotraces.org) is based on the digital data package and provides section plots and animated 3D scenes for many of the parameters, allowing quick overviews of the occurrence of geochemically relevant tracers. The 3D scenes provide geographical context crucial for correctly assessing extent and origin of tracer plumes as well as for inferring processes acting on the tracers and shaping their distribution. The numerous links to other tracers, sections and basins found on section plots and 3D animations allow quick switching between parameters and domains and facilitate comparative studies. In addition, eGEOTRACES can help in teaching and outreach activities and can also facilitate conveying societally relevant scientific results to interested laymen or decision makers.
| Usage: Users select parameters, cruise tracks and ocean basins using list-boxes and interactive maps. eGEOTRACES then presents parameter distributions along the selected sections, or animated 3D scenes showing parameter distributions along all available sections in the selected basin. Section plots and 3D animations contain the names of the scientists who produced or are responsible for the data. Section pages also contain a link to the original publications associated with the given parameter and cruise. |
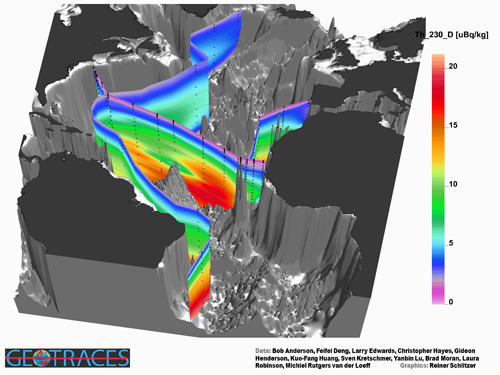 Figure 1*: 3D scene showing the distribution of dissolved Thorium-230 (230Th) in the Atlantic.
230Th is a tracer of the solution/particle exchange and particle sinking velocities. When the particle abundance is sparse (e.g. gyres), its activity increases with depth. Dissolved 230Th is depleted at depth when encountering nepheloid layers and/or hydrothermal particles.
*Note: all figures in this page follow the same colour code: warm colours (red, orange, etc.) indicate high concentrations.
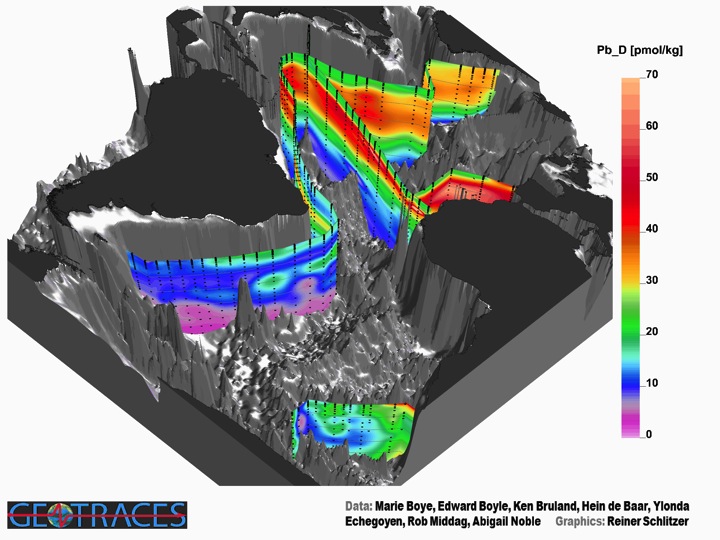 Figure 2*: 3D scene showing the distribution of dissolved lead (Pb) in the Atlantic.
This tracer is of anthropogenic origin. The dominant input into the North Atlantic and spreading with the main deep water masses are clearly visible on this 3D view.
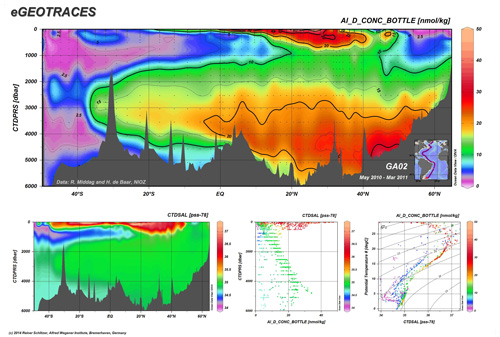
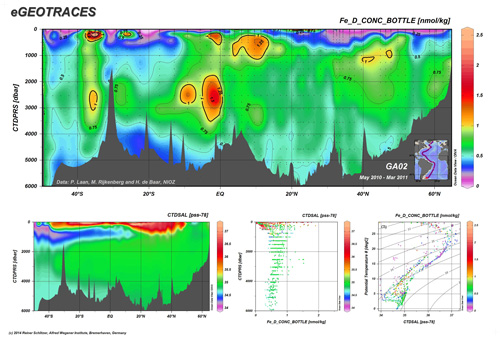 Figures 3 and 4*: These figures compare full-depth distributions of iron (Fe) and aluminium (Al), along a North-South section in the Atlantic Ocean.
Both tracers are lithogenic. Their contrasting distributions reflect strong differences in their internal biogeochemical cycles and show the importance of high-resolution sampling to distinguish small-scale features.
Citation
Please cite the GEOTRACES Intermediate Data Product 2014 (IDP2014) as:
Mawji, E., et al., The GEOTRACES Intermediate Data Product 2014, Mar. Chem. (2015). DOI: http://dx.doi.org/10.1016/j.marchem.2015.04.005.