GEOTRACES IDP2014 in Science
3D Maps Reveal a Lead-Laced Ocean
The GEOTRACES programme is collecting a large amount of trace element data compared to what was available before. This is well illustrated with the 3D view of lead concentrations in the Atlantic Ocean (see figure below), as discussed in the Science article below. For the first time, scientists can trace the pathway that lead has followed since its atmospheric deposition on the surface of the North Atlantic Ocean in the 20th century to its present location, at around 1000 meters depth. The maximum Pb concentrations in the figure (bright red) are slightly higher than 60 pmoles/kilogram (12 parts per trillion), and clearly show the imprint of the use of leaded gasoline by humanity, which has been phasing out since the mid 70s. Measurements of anthropogenic trace gases (chlorofluorocarbons and sulfur hexafluoride) on the section between North America and Africa (not shown) confirm that the maximum lead concentrations occur within water masses that sank from the ocean surface at the time of peak atmospheric lead deposition.
Read the Science mag article at:
http://news.sciencemag.org/chemistry/2014/02/3d-maps-reveal-lead-laced-ocean
Read the paper version (Science 7 March 2014 Vol. 343 no. 6175 p. 1070):
http://www.sciencemag.org/content/343/6175/1070.full
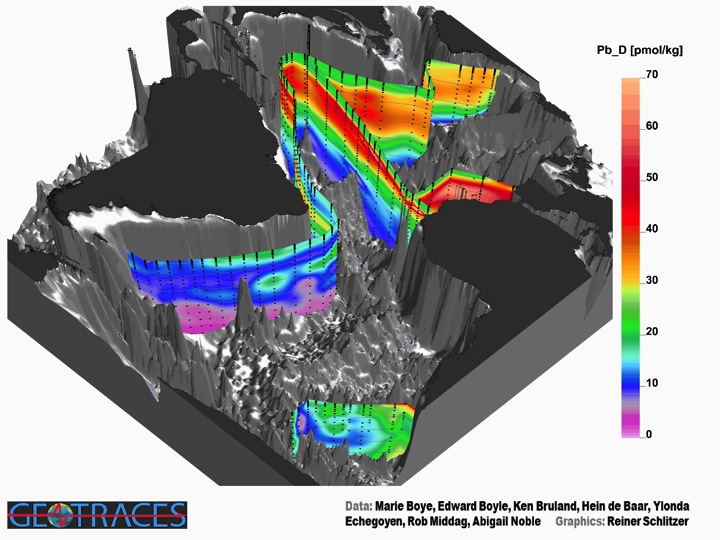
Figure: Distribution of dissolved lead in the Atlantic (eGEOTRACES.org)