- This event has passed.
Introduction to the Awesome OCIM
12 August 2018
Introduction to the Awesome OCIM
Dates: 12 August 2018
Location: Boston, USA
Download the annoucement as pdf
 Introduction to the Awesome OCIM
Workshop, August 12 th, 2018, MIT campus, Boston MA, 10 AM to 5 PM (Sunday preceding Goldschmidt 2018)
The Awesome OCIM is a new modeling toolbox designed to bring cutting-edge transport matrix models to a wide community of users. This workshop will introduce the AO to the GEOTRACES community and the wider community of chemical oceanographers. Modeling novices welcome!
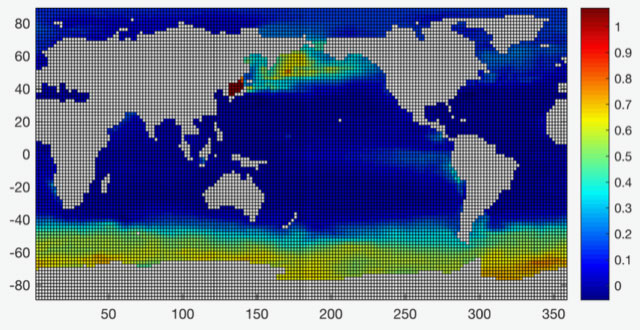
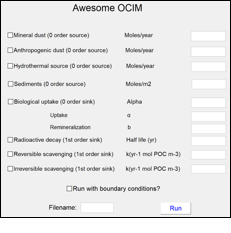
The AO uses Ocean Circulation Inverse Model (OCIM) transport for realistic global 3d circulation. Within this circulation, broad features of the distribution of many marine TEIs can be achieved by combining just a few processes. For example, iron might be modeled as a combination of atmospheric and sedimentary sources, biological uptake, and remineralization. Thorium might be modeled with radioactive production and decay, plus scavenging. A clickable interface allows the user to include processes such as these, and tune their magnitude to match observed GEOTRACES data. Further adjustments to biogeochemical cycling can be achieved with changes to the underlying Matlab code.
This workshop is designed for graduate students, postdocs, and faculty with an interest in learning more about the AO. No previous experience with modeling is necessary. All participants will be given the latest version of the AO software, and talks will include examples of how the AO and other similar OCIMs are used in research, an introduction to using the AO through the GUI and underlying Matlab code, and a hands-on opportunity to recreate the global distribution of your favorite TEI using the AO. Also there will be sandwiches.
 |
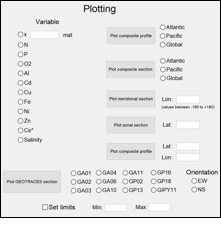 |
Example Graphical User Interfaces (GUIs) for running the AO and plotting model output with the AO. The behavior of many TEIs in the ocean can be approximated by combining a few key processes such as dust and hydrothermal inputs, biological uptake and remineralization, radioactive decay, scavenging, etc. Both GEOTRACES data and model output can then be plotted using a separate GUI.