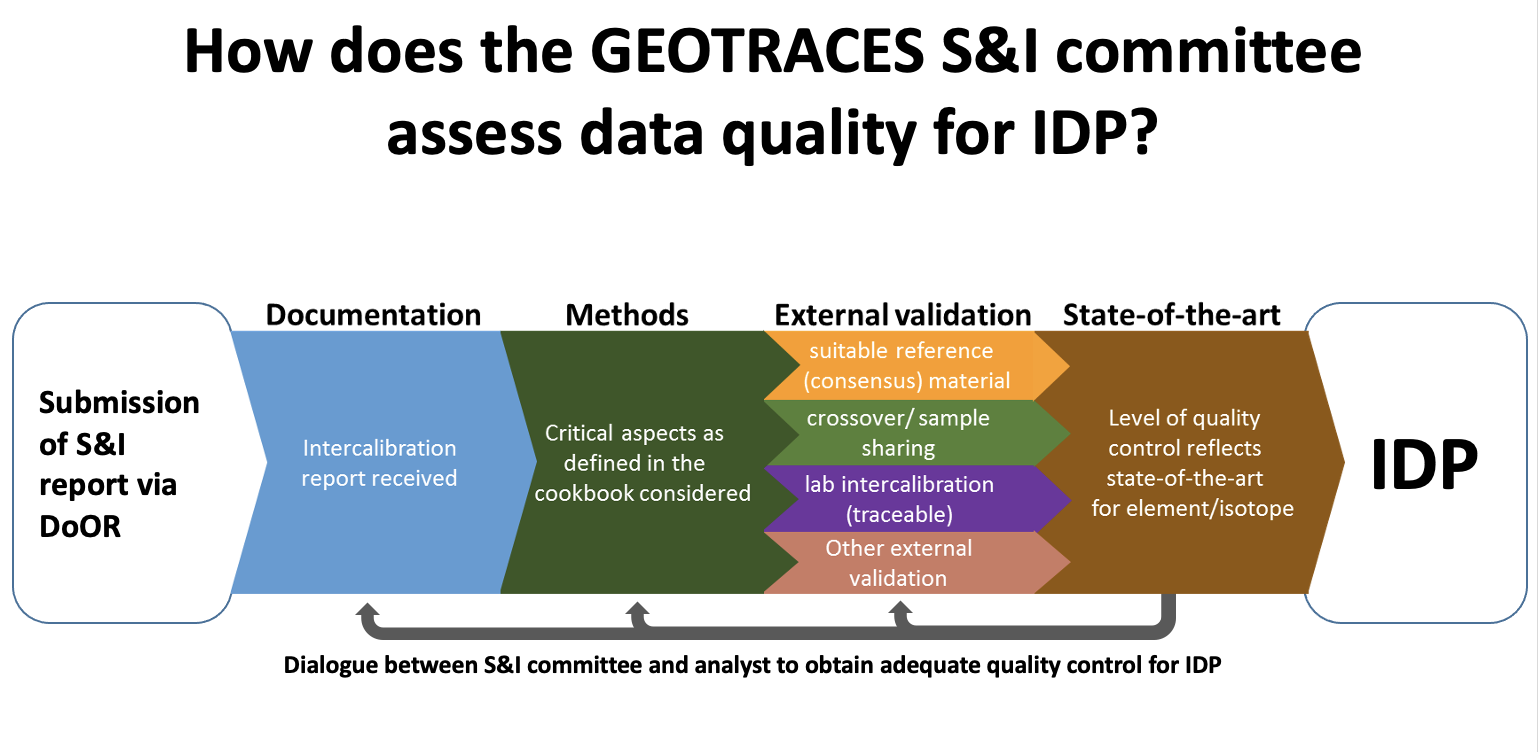
A flow chart describing how the GEOTRACES Standards and Intercalibration Committee (S&I) committee assess data quality for the Intermediate Data Product is presented below. The flow chart is also available to download as pdf file here.
As illustrated in the flow chart, data is assessed by the S&I committee based on the intercalibration report submitted by the analyst. A dialog is established between the S&I committe and the analyst to ensure each parameter is measured against the state-of-the-art for the parameter.